Research Scoring Methodologies
- 26 Feb 2024
- 28 Minutes to read
- DarkLight
Research Scoring Methodologies
- Updated on 26 Feb 2024
- 28 Minutes to read
- DarkLight
Article Summary
Share feedback
Thanks for sharing your feedback!
G2 strives to be the world’s most trusted and influential marketplace for software buyers, sellers, and service providers. In addition to G2’s rigorous review moderation process, that trust is earned by applying a consistent set of guidelines, methodologies, and definitions to give buyers the best view of a particular B2B software market.
This page contains detailed information about G2’s research scoring methodologies, including scoring for software products and service providers, sorting logic, and G2 Market Report inclusion criteria.
G2 Score
G2 uses a proprietary algorithm to rank products based on reviews gathered from the user community as well as data aggregated from online sources and social networks. The result of this algorithm is the G2 Score, which is a standardized score used to compare products within the same G2 category.
Scores for a product or service might differ between their corresponding G2 categories due to the reviews analyzed and G2’s scoring normalization process.
This section describes the discrete scoring methodologies used to calculate the G2 Score for software and service providers.
Software
A software’s G2 Score is calculated using two scoring components: Satisfaction and Market Presence.
Satisfaction
G2’s Satisfaction score is derived from the following metrics.
| Metric group | Metric | Description | Importance |
|---|---|---|---|
| Review response data | User-focused scores | G2 review form questions:
| High |
| Admin-focused scores | G2 review form questions:
| Medium | |
| General satisfaction scores | G2 review form questions:
| Low | |
| Significance | Review volume | To assess popularity and statistical significance, review response data is weighted based on the total number of reviews. | High |
| Relevance | Review recency | Because recent reviews are more relevant to buyers, older reviews are weighted less. For more information, refer to the Review Decay section. | High |
| Review quality | Reviews that are more thoroughly completed are weighted more heavily. Each review is assigned a readability score using the Flesch-Kincaid Reading Ease scale. | Medium | |
| Review source | Reviews collected from current product users or from users who have more experience with the product are given increased weight. Reviews solicited without incentive are also weighted more heavily. Per the Federal Trade Commission (FTC) guidelines, vendors should not segment customers to solicit only positive reviews. Any reviews obtained via segmentation violate G2’s Community Guidelines and are subject to removal. | Low |
Market Presence
G2's Market Presence score incorporates metrics derived from G2 reviews and third-party sources. Market Presence is based on data for both products and their corresponding vendors, with increased weight given to product-specific metrics.
The following table describes several key factors influencing G2’s Market Presence score, listed in order of importance.
| Metric group | Metric | Description | Importance |
|---|---|---|---|
| Review count | Weighted review count by category | The number of non-business partner reviews attributed to the category. Reviews are weighted based on the same factors used in G2’s Satisfaction score, including review quality, review recency, and review source. | High |
| Employee count and revenue Refer to the Scoring appendix for more information. | Employees on ZoomInfo | The number of employees reported by ZoomInfo. | High |
| Employees on LinkedIn | The number of employees reported by LinkedIn. | High | |
| Employees on Crunchbase | The number of employees reported by Crunchbase, represented as a range. | Medium | |
| Revenue on ZoomInfo | The estimated B2B software revenue reported by ZoomInfo. | Medium | |
| Web presence | Moz Product Page Authority | How well the product’s webpage will rank on search engine result pages (SERPs), predicted by Moz. | Medium |
| Moz Vendor Domain Authority | How well the vendor’s website will rank on search engine result pages (SERPs), predicted by Moz Domain Page Authority. | Medium | |
| Estimated Search Volume | The estimated volume for vendor-branded search terms based on data from STAT Search Analytics and other sources. | Medium | |
| SEMrush Total Traffic | The sum of organic and adwords traffic, reported by SEMrush (US database only). | Medium | |
| Spyfu Traffic Budget | The estimated advertising spend for the vendor’s paid search keywords, as reported by Spyfu (US database only). | Low | |
| SEMrush Traffic Quality | The monetary value of organic traffic to the vendor’s website, divided by the number of keywords tracked by SEMrush for the website (US database only). | Low | |
| Growth, influence, and engagement | Crunchbase Rank | The Crunchbase rank for the vendor. Crunchbase ranks organizations on several variables, including total funding amount, relationship with other organizations, and pageviews. | Low |
| Vendor employee growth | The change in employee count since the last time company size was verified on LinkedIn, normalized by company size. Employee growth is reported for a vendor 12 months following their first appearance on G2 Grid®. | Low | |
| X (formerly Twitter) Product Followers | The number of followers for a product's primary X handle (if available). | Low | |
| X (formerly Twitter) Vendor Followers | The number of followers for a vendor’s primary X handle (if available). | Low | |
| Glassdoor Rating | The vendor’s employee satisfaction rating on Glassdoor (if available). | Low | |
| Year Founded | The year the vendor was founded. Vendors who have been in business longer are weighted more positively. | Low |
Product Suites
Product suites are groupings of products that offer buyers an expanded range of features and functionality, prebuilt integrations, and a simplified vendor relationship. Each G2 Product Suite has its own profile, which can be customized in my.G2.
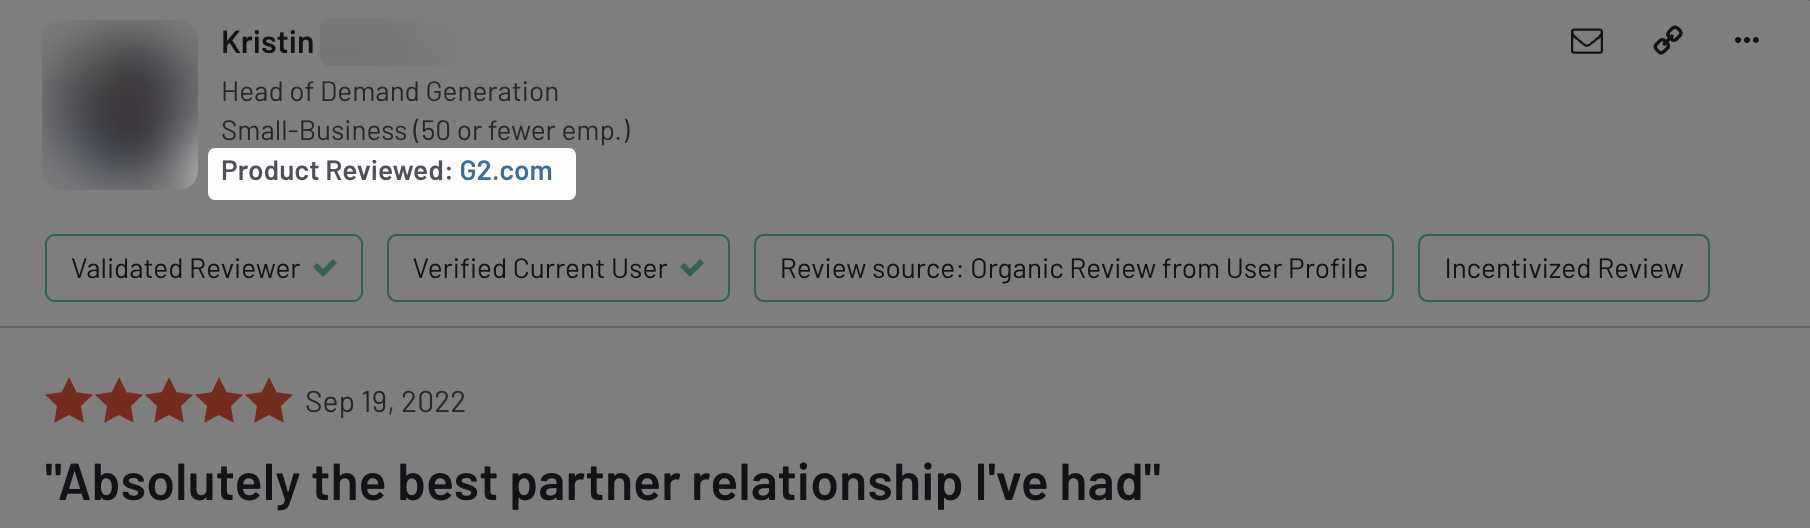
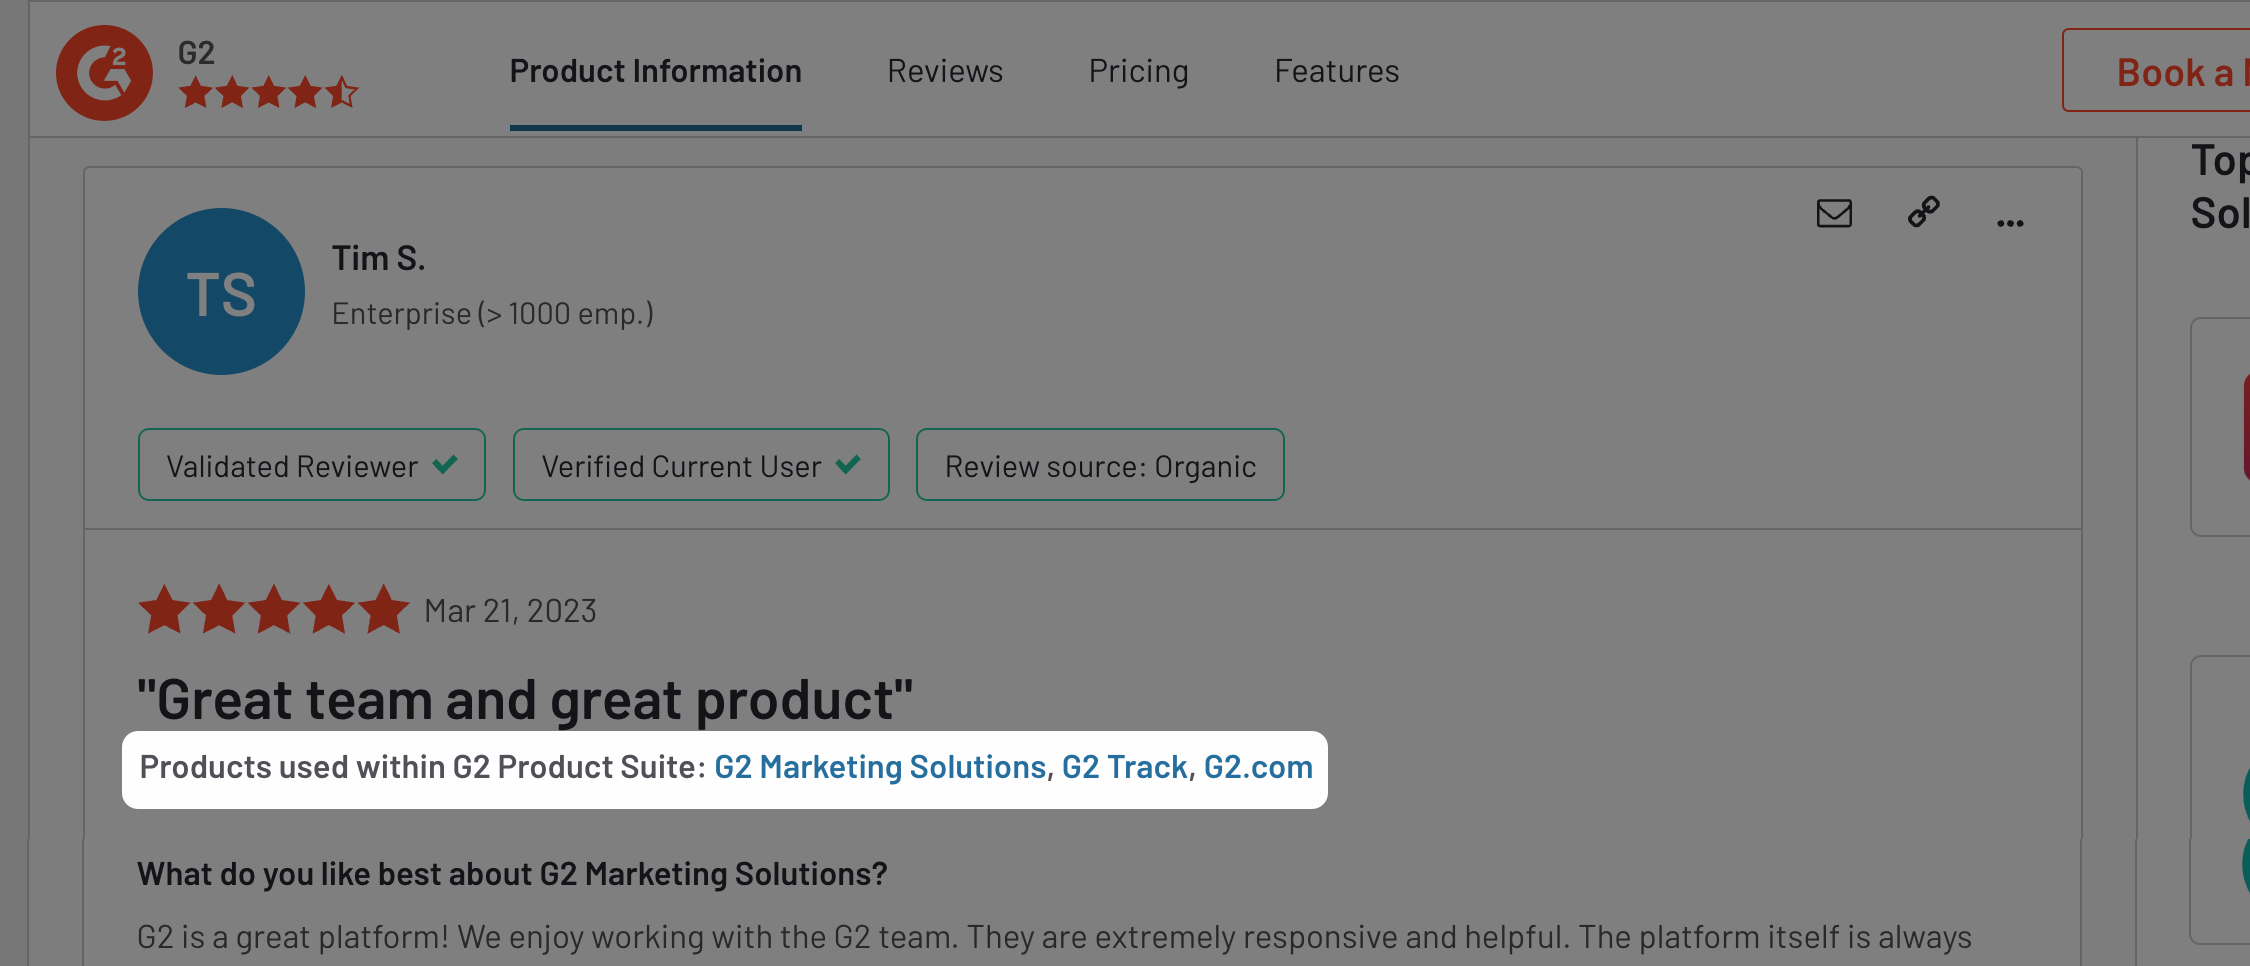
Suite profiles aggregate the reviews from each of the product profiles in the suite, and each review includes the name of the original product reviewed.
Customers can write reviews for a product suite, which also appear on the corresponding product profiles.
Reviews for product suite profiles do not impact G2 scoring or inclusion criteria for G2 Market Reports for product suites or their associated products.
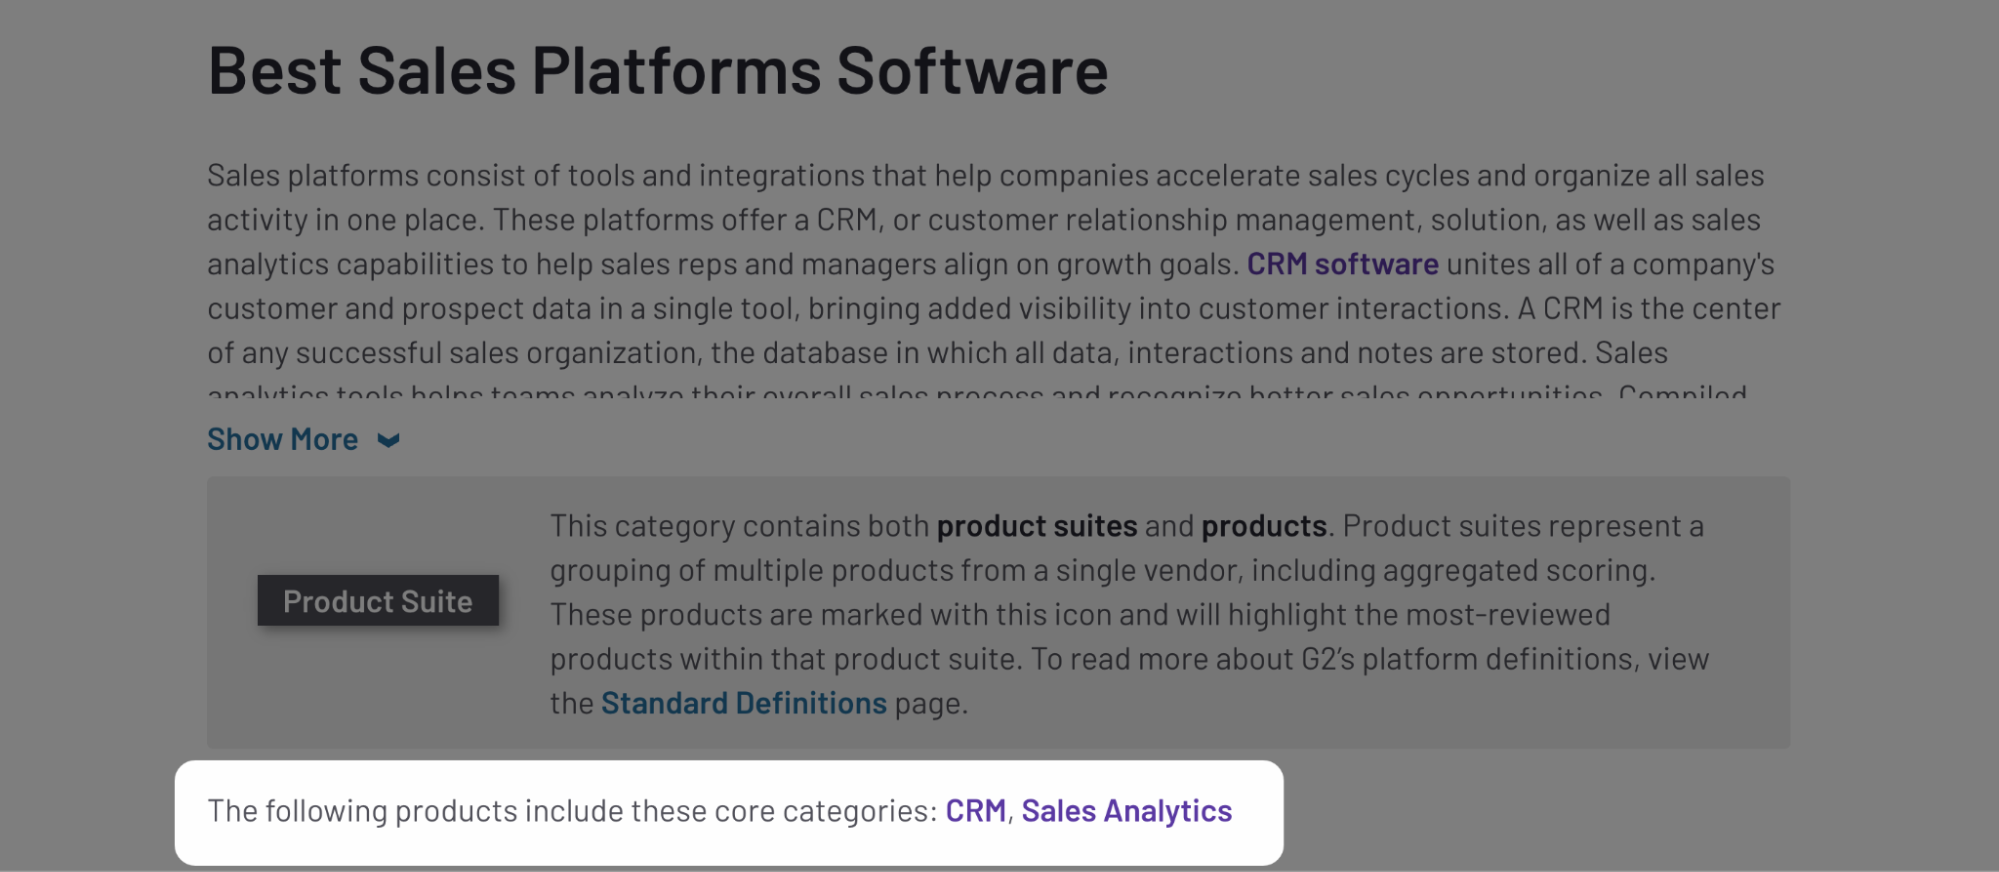
Similar to how product suites package G2-listed products together, product suite categories enable buyers to compare solutions with functionality that spans multiple G2 categories.
To be included in a suite category, a suite must have G2-listed products in all of the required product categories determined by G2’s Market Research team.
Two types of product categories can be included in a product suite category:
- Core categories define the essential features of the product suite category. A solution must offer all the required features of the core categories as defined by G2’s research team.
- Supplementary categories are commonly seen in solutions across competitors but are not necessary to the core functionality of the solution. A product suite is not required to have products in any supplementary categories to qualify for inclusion in the suite category.
Product suites use the same Satisfaction and Market Presence scoring methodology as software products, but scores are aggregated across categories, with core categories receiving greater weight than supplementary categories.
You can check the requirements for a suite category by navigating to the corresponding category page on G2, and then referring to the core categories listed. For example, to be eligible for a Sales Platforms suite category, your suite must have one or more products in the CRM and Sales Analytics product categories.
Services
A service provider’s G2 Score is calculated using two scoring components: Satisfaction and Market Presence/Proficiency.
Satisfaction
G2’s Satisfaction score for service providers is derived from the following metrics.
| Metric | Description | Importance |
|---|---|---|
| Review response data | G2’s service provider review form contains a distinct set of service-focused attributes that assess the provider-client relationship, including Professionalism, Expertise of Team, Responsiveness, Execution Ability, and Communication Skills. | High |
| Review volume | To assess popularity and statistical significance, review response data is weighted based on the total number of reviews. | High |
| Review recency | Because recent reviews are more relevant to buyers, older reviews are weighted less. For more information, refer to the Review Decay section. | Medium |
| Review quality | Reviews that are more thoroughly completed are weighted more heavily. Each review is assigned a readability score using the Flesch-Kincaid Reading Ease scale. | Low |
Market Presence/Proficiency
G2's Market Presence/Proficiency score for service providers incorporates metrics that assess a service provider’s proficiency, experience, and reach.
| Metric group | Metric | Description | Importance |
|---|---|---|---|
| Capabilities and Competencies | Category Expertise | The number of distinct software competencies associated with an ecosystem service provider, as verified by G2’s Market Research team. This metric is only used for providers within child categories of the Ecosystem Service Providers parent category. | High |
| Company Age | Year Founded | The year the company was founded. Service providers who have been in business longer are weighted more positively. | Medium |
| Geographic Diversity | Reviewer Countries | The number of unique countries represented among a provider’s reviewers. | Medium |
| Operating Countries | The number of countries where a provider conducts business, as reported by ZoomInfo. | Medium | |
| Languages | The number of languages supported by a service provider, as reported by the provider. | Low |
Accessing your scoring data
You can access Satisfaction and Market Presence scores for your product via the Competitors tab in my.G2.
my.G2 displays the raw inputs into G2's Satisfaction and Market Presence scores, which are updated based on the cadences listed in the Metric update frequency section. For more information on how this data is used to calculate your product's G2 score, refer to the Normalization and Employee count and revenue sections.
For further questions related to data from third-party sources, please contact G2 Support first. You might be required to contact third-party sources directly to request updates.
You can also visualize the distribution of your product's reviews relative to G2's review decay algorithm from the Review Activity tab.
Refer to the Review Decay section for more information.
Scoring appendix
This section provides supplemental information about G2’s Satisfaction and Market Presence scores.
Normalization
To ensure buyers understand how your product performs relative to your competitive landscape, G2 weights and normalizes scoring for all products in your category on a 0 - 100 scale.
This means your product’s rank is determined by both raw scores as well as the distribution of scores across the competitors in your category.
For example, if multiple products are near the category average, small differences in absolute scores can be assigned extra magnitude during the normalization process to ensure that buyers can easily identify differences between products.
Review decay
To ensure that Satisfaction and Market Presence scoring maintain relevance to buyers at any point in time, G2 applies a decay to reviews as they age. Decay begins the moment a review is submitted and recalculates daily.
Specifically, a review decays gradually for the first 90 days and maintains a stronger weight for the first 18 months, after which the rate of decay accelerates. After about three years, the review reaches approximately 3% of its original weight and maintains that weight in perpetuity.
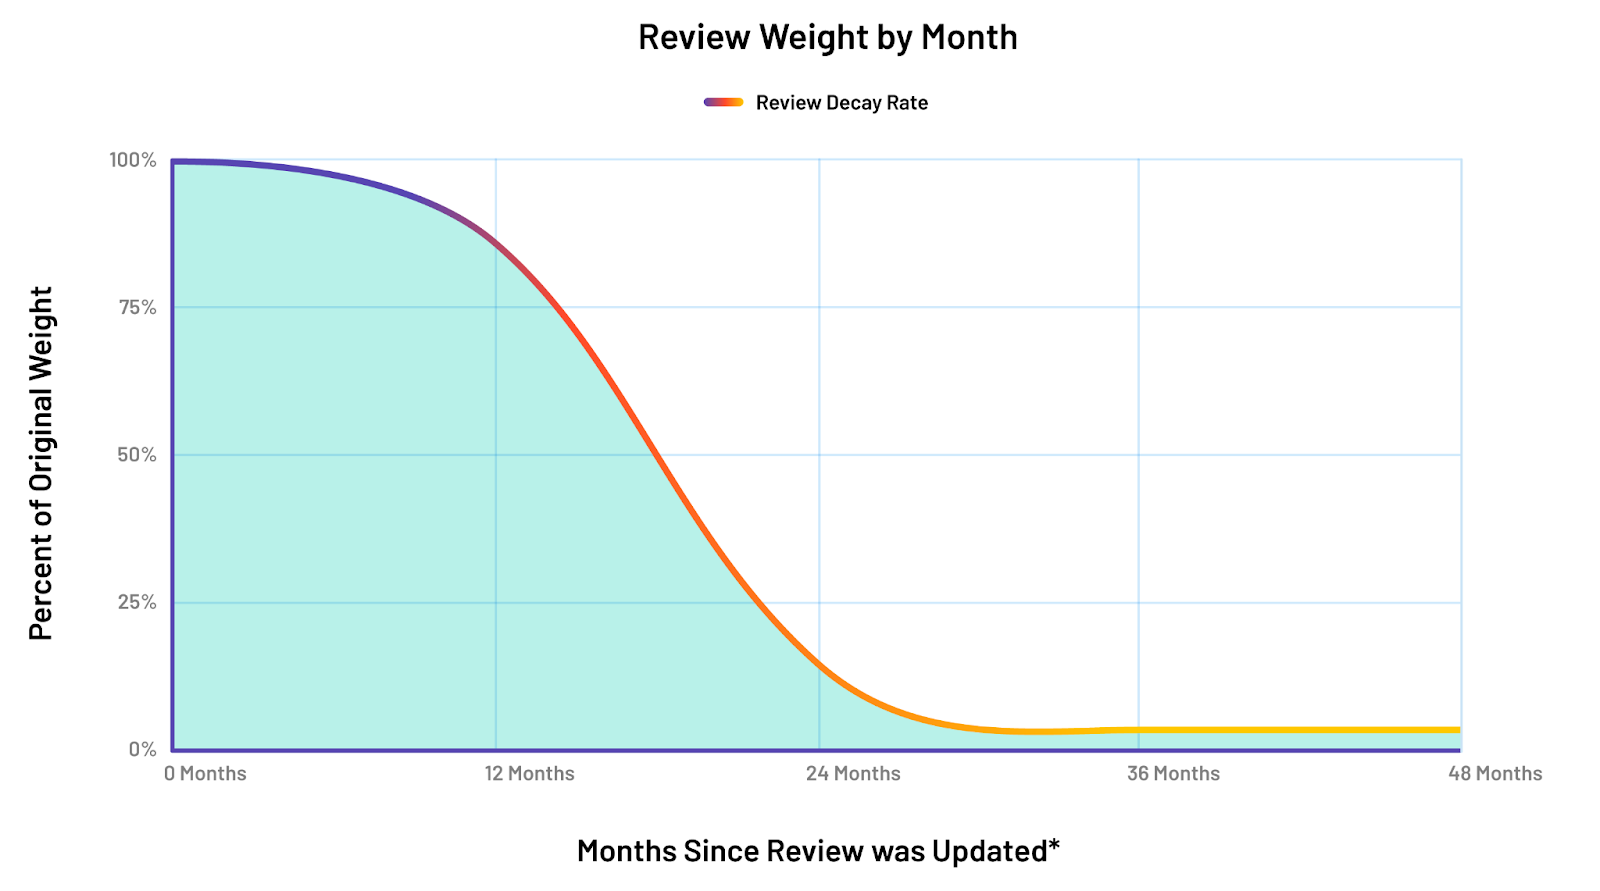
Review decay resets if a reviewer updates their existing review.
Business partners
Users who have a business relationship with a vendor, such as resellers, can often provide valuable insight and are not restricted from leaving reviews on G2. However, because of the potential bias of such relationships, business partner reviews do not impact the star rating, G2 Score, Satisfaction or Market Presence scores, Best Software lists, or other G2 ranking algorithms. These reviews are flagged with a "Business Partner" label on the review.
Web presence
This section provides more information about the third-party sources G2 uses to assess web presence:
- Moz Product Page Authority predicts how well a specific page will rank on search engine result pages (SERP). G2 uses the authority of pages highlighting the features and functionality of a product to benchmark web presence against both the competitive landscape and other products a vendor might offer.
- Moz Domain Authority predicts how well a domain will rank on SERP and tracks the overall strength of a vendor’s website in organic SEO rankings.
- SEMrush Total Traffic measures the sum of organic and adwords traffic to a company’s site, reported via the Domain Overview Reports API. G2 uses total traffic as a relative scale (low, medium, high) to evaluate a vendor’s strength in traffic. This API includes US databases only.
- SEMrush Traffic Quality measures how well a company ranks organically and the value of their ranking keywords. G2 calculates this metric by dividing SEMrush’s organic cost (the value of their organic traffic if it were purchased through a pay-per-click advertising channel) by the total number of organic keywords for the website. Traffic quality uses a relative scale (low, medium, high) to evaluate a vendor’s strength in organic traffic and SEO.
- Spyfu Traffic Budget tracks ad spend by crawling search results, reported via their V1 API. G2 uses traffic budget as a relative scale (low, medium, high) to account for inorganic web presence growth.
- STAT Search Analytics tracks company-branded search terms to measure the overall interest in a product or company and provide a forward-looking measure of how many users or customers a product may have. G2 makes adjustments to the raw search volume numbers to account for searches that may be unrelated to the software product. This information is combined with other web signals to estimate the level of interest in a particular product.
Employee count and revenue
Employee count is traditionally used as a proxy for assessing company size, available resources, and a predictor for revenue, as more employees enable greater productivity and output overall.
G2 believes this information is important to convey to buyers to help them assess the success of the software product, expectations on implementation and support, and how established a company is. G2 uses multiple third-party sources — including ZoomInfo, LinkedIn, and Crunchbase — to mitigate inaccuracies in employee count and revenue data.
Companies that have significant revenue-generating operations outside of B2B software only receive the number of employees estimated to be focused on revenue-generating activities related to B2B software.
For example, if Delivery Company X has a B2B-facing application for businesses to manage and monitor their package deliveries, but their public financial statements indicate that their delivery management software only accounts for 3% of their revenue, a maximum of 3% of their total employees will be used in Market Presence calculations.
Further, for large enterprises, G2 maps the organization’s total employee count and revenue to individual products and categories based on the information available, including a combination of weighted review counts and data from third-party sources, such as SERP ranking for individual products.
Metric update frequency
G2 updates first- and third-party data on the following cadence.
| Source | Update frequency |
|---|---|
| Crunchbase | Daily |
| Employee share | Daily |
| G2 review counts and ratings | Daily |
| SEMRush | Weekly |
| STAT Search Analytics | Weekly |
| X (formerly Twitter) | Weekly |
| Glassdoor | Monthly |
| Monthly | |
| Moz | Monthly |
| Spyfu | Monthly |
| ZoomInfo | Monthly |
Mergers and acquisitions
When a product is acquired, G2 tracks metrics for both the acquiring and acquired organization to support Market Presence calculations.
The impact of an acquisition will depend both on the date of the acquisition and on the type of acquisition. Changes to web and social metrics, if warranted, will occur as soon as the taxonomy changes are reflected on G2.com. Changes to G2’s employee and revenue estimates are phased in over 18 months from the close of the acquisition.
To request updates to your company’s metrics following acquisition, please refer to the submission guidelines, then contact G2 Support.
G2 uses the following logic to handle Market Presence updates for mergers and acquisitions:
| Type of Acquisition | Description |
|---|---|
| Financial Acquisition | Pure financial acquisitions, such as acquisition by a private equity firm, have no direct impact on Market Presence because there is no change to the vendor’s employee count, web presence, or other firmographic details. |
| Subsidiary Acquisition | Business operations, website, and branding remain independent. G2 continues to track the employees and revenue for the acquired organization but makes an upward adjustment to these metrics to reflect the additional resources of the parent company. The size of the adjustment depends on the relative size of the two organizations but tends to have a modest impact on Market Presence. Web metrics, social metrics, year founded, vendor employee growth, and Glassdoor ratings continue to reflect the acquired organization. This adjustment is not viewable in my.G2. |
| Divisional Acquisition | Business operations are combined, but the acquired organization maintains its own website and branding. This typically results in separate LinkedIn, Crunchbase, and ZoomInfo profiles for the organizations. G2 continues to track the employees and revenue for the acquired organization but makes an upward adjustment to these metrics to reflect the additional resources of the parent company. The size of the adjustment depends on the relative size of the two organizations. Web metrics, social metrics, year founded, vendor employee growth, and Glassdoor ratings continue to reflect the acquired organization. Although the impact is larger than a subsidiary acquisition, the overall change to Market Presence may be modest, as product-specific Market Presence metrics receive the greatest weight in scoring. This adjustment is not viewable in my.G2. |
| Company Merge | Business operations, websites, and branding for acquiring and acquired organizations are combined, but products can still be purchased independently. Employees and revenue of the acquired organization are gradually phased in to reflect the new employee count and revenue of the acquiring organization. After the phase-in is complete, G2 estimates the share of employees and revenue in the same fashion as all multi-product vendors. Web metrics, social metrics, year founded, vendor employee growth, and Glassdoor ratings are updated shortly after the acquisition is recorded. |
| Product Merge | Business operations, website, and branding for acquiring and acquired organizations are combined, and each product’s functionality is combined into one offering. All relevant reviews, as evaluated by G2’s research team, are moved to the new, combined product. The combined product inherits the categorization of the old products and the estimated share of employees and revenue dedicated to each category. Employees and revenue of the acquired organization are gradually phased in to reflect the new employee count and revenue of the acquiring organization. After the phase-in is complete, G2 estimates the share of employees and revenue in the same fashion as all multi-category products. Web metrics, social metrics, year founded, vendor employee growth, and Glassdoor ratings are updated shortly after the acquisition is recorded. |
Sorting
This section describes the logic used to sort reviews on G2 product profiles, products or services on G2 category pages, and competitors on G2 alternatives pages.
Reviews
By default, reviews on your G2 profile are displayed using G2 Sort, a custom sorting algorithm that incorporates the following data points:
- Recency of the review
- Amount of feedback provided in the review
- Attribution (Did the reviewer keep their name and company public?)
- Whether the reviewer is a current user of the solution (included a screenshot)
- Community engagement with the review
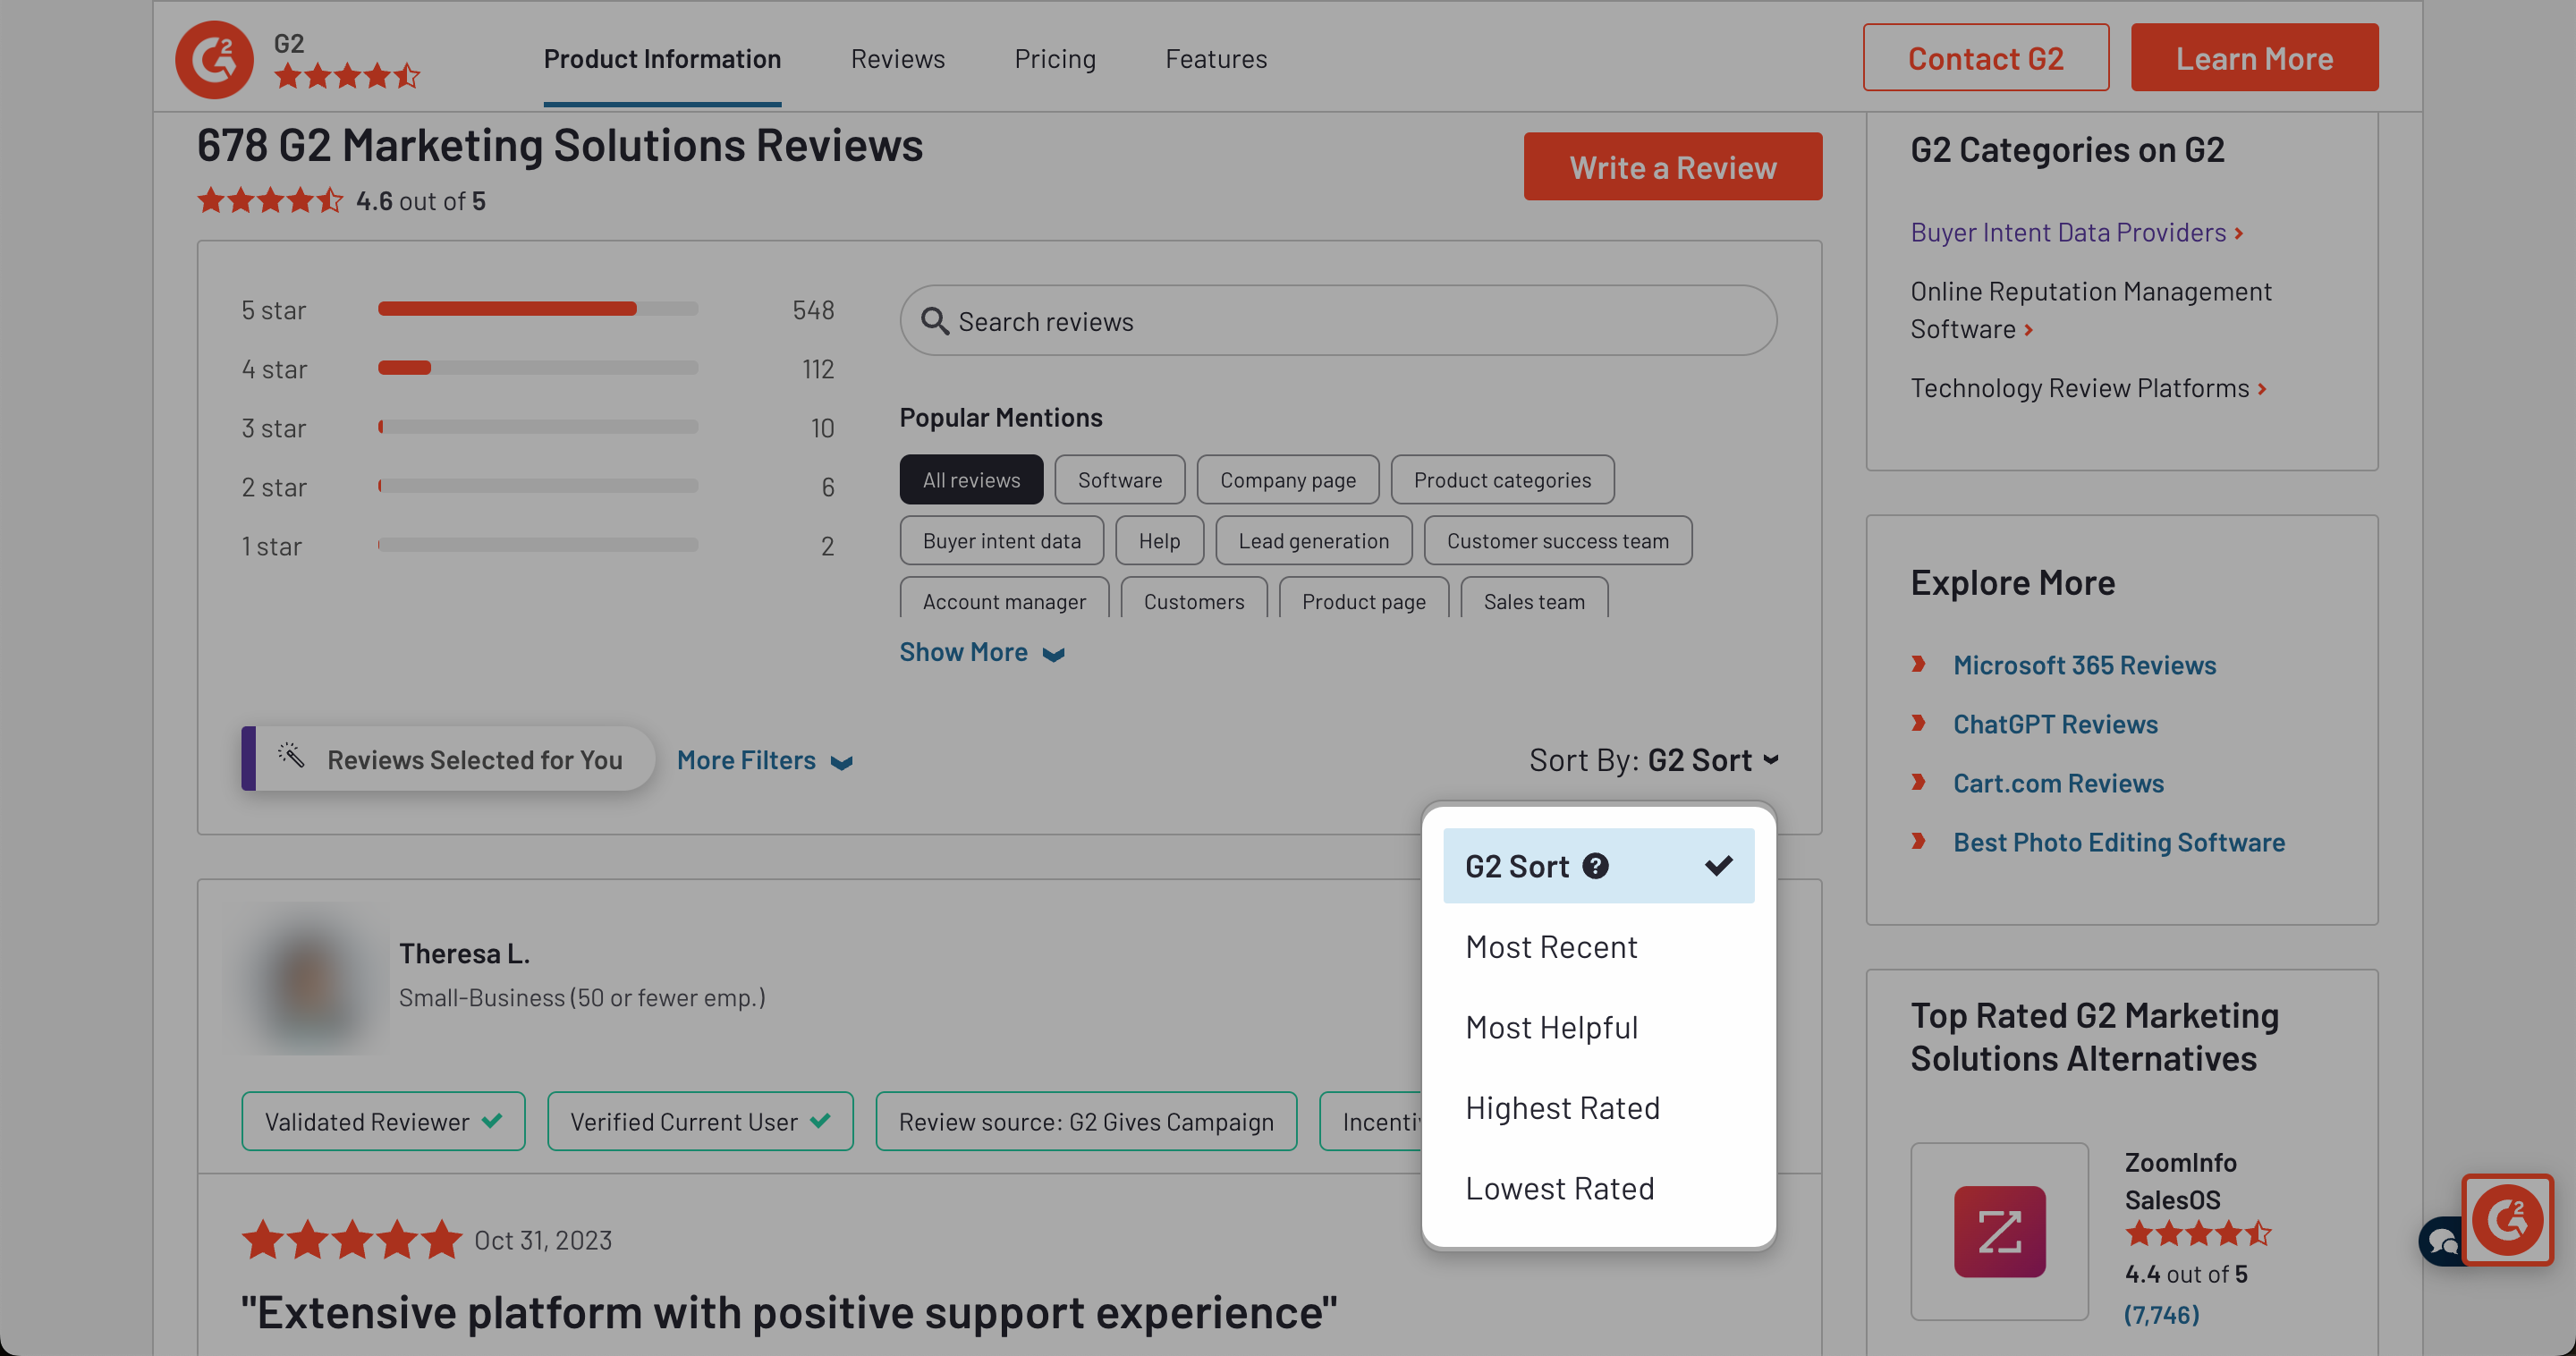
G2 also offers the following review sorting options to buyers:
- Most Recent: Sort by date.
- Most Helpful: Sort by highest community engagement, including likes and comments.
- Highest/Lowest Rated: Sort by star rating.
The star rating for your product is based on responses to the Likely to Recommend question on the G2 review form.
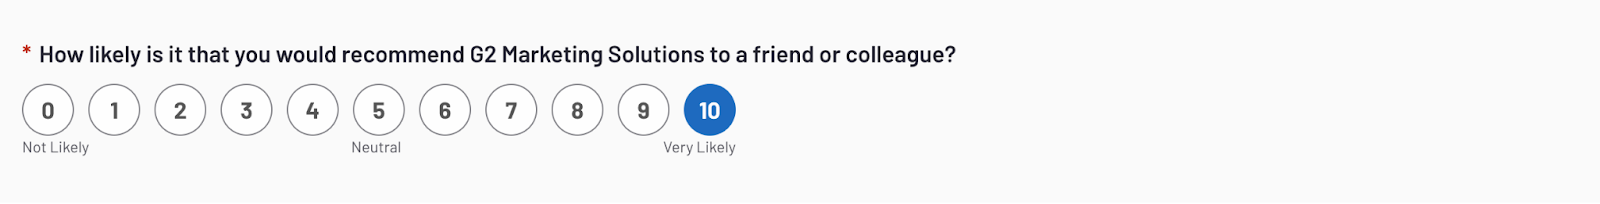
G2 calculates the average star rating for your product by dividing responses to the Likely to Recommend question in half, then rounding up to the nearest half star.
Pros and Cons
Pros and Cons highlights the strengths and weaknesses of products relative to their category.
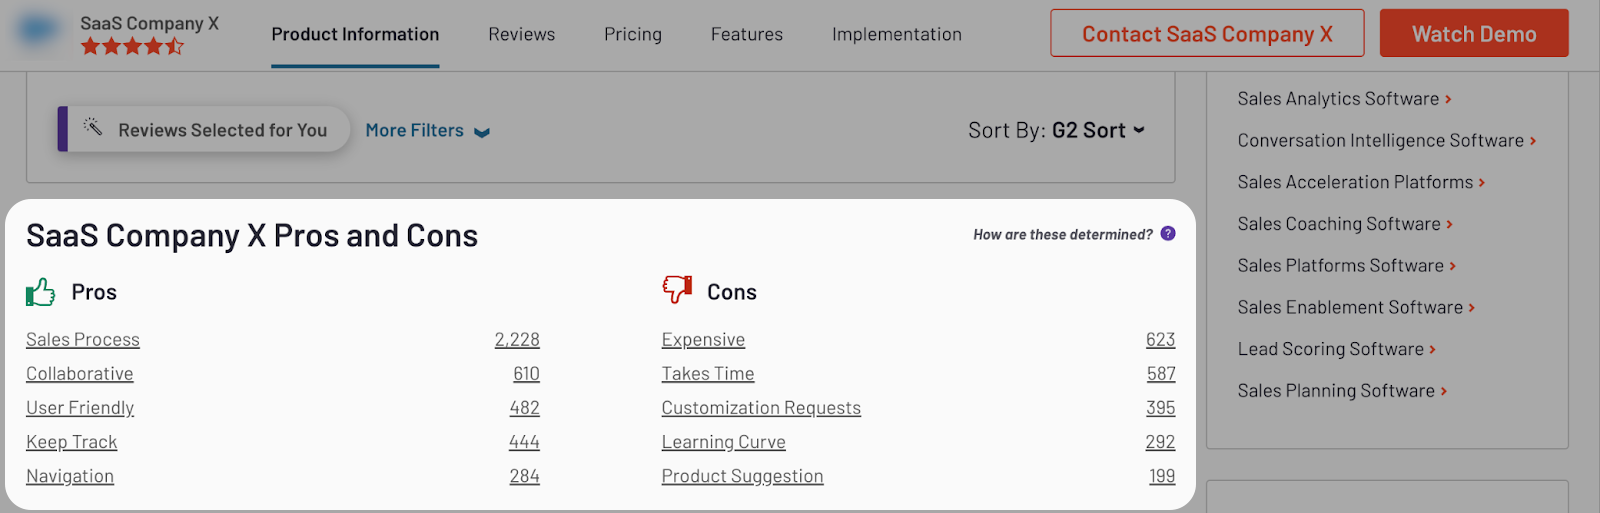
All text-based product reviews, including G2 Product Suite reviews, are considered for Pros and Cons. Video reviews and business partner reviews are not included in the analysis.
G2 examines all reviews for a category from the past 18 months, then identifies five common Pros and five common Cons across the category. Pros and Cons are then assigned to a product based on semantic similarity to at least one of their reviews.
Pros and Cons are updated every 30 days on the 15th of the month and reviewed by G2 for quality assurance.
If a product is in multiple G2 categories, the top five Pros and Cons, based on the highest number of associated reviews, across all categories will be displayed.
Overall Review Sentiment
Overall Review Sentiment provides insights from G2 reviews into several measures of customer sentiment for products, product suites, and services.
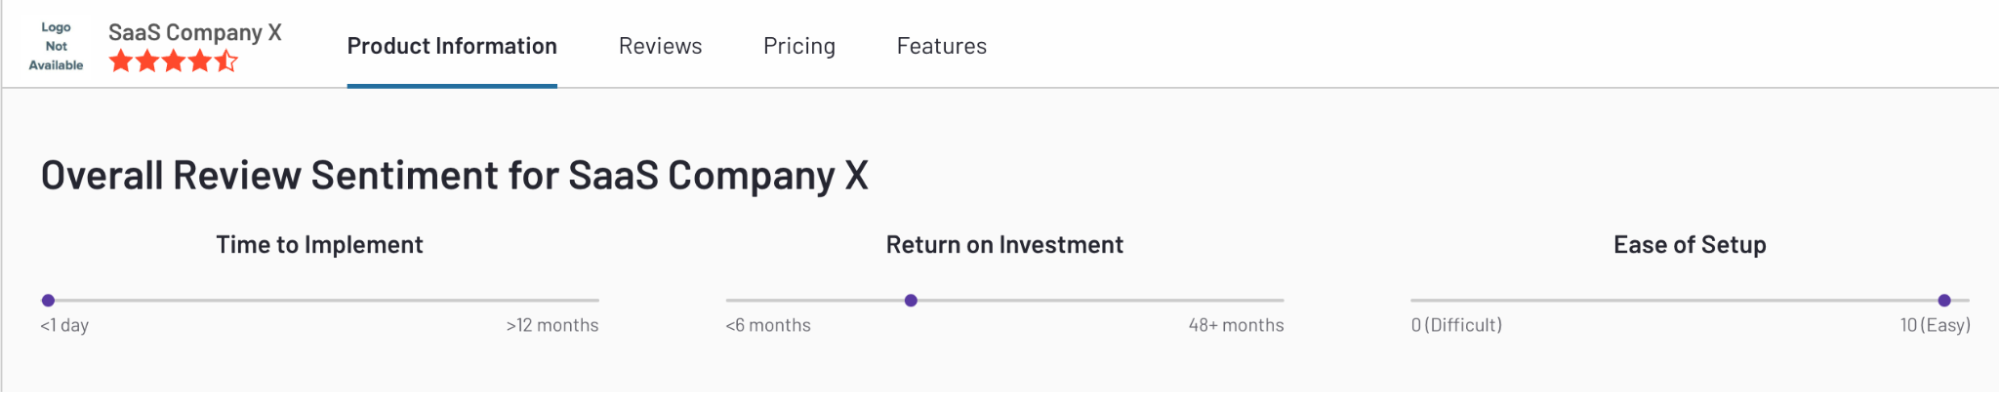
The Overall Review Sentiment panel appears when a product, product suite, or service has at least 10 responses to one of the corresponding review form questions.
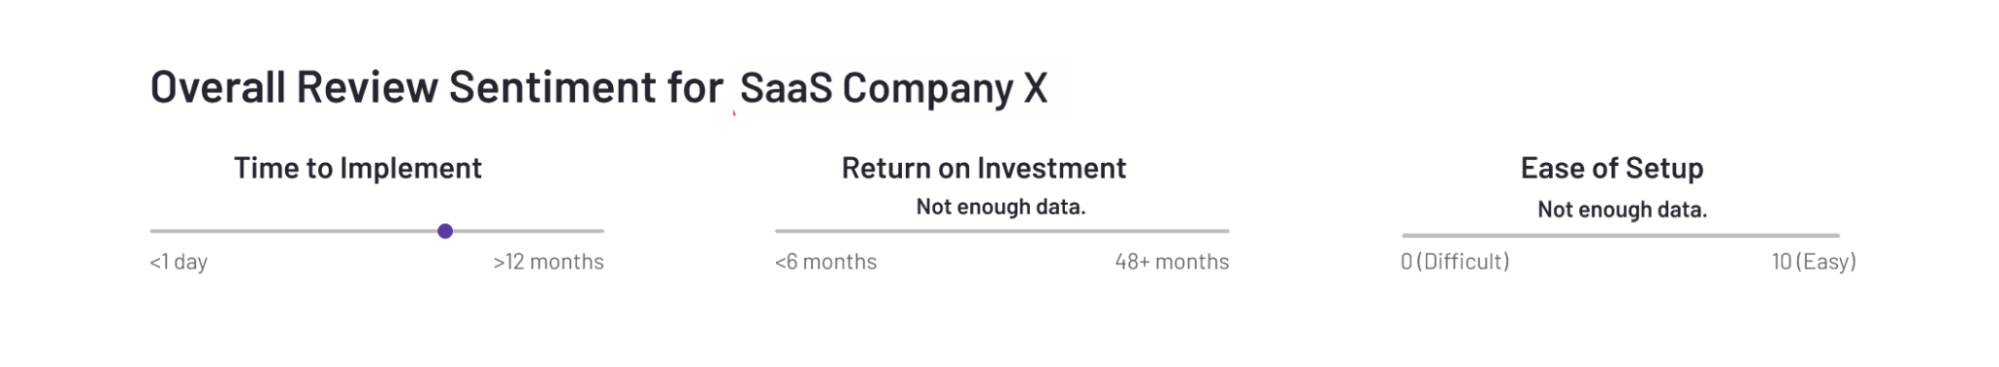
If a product, product suite, or service does not have at least 10 responses to any of the corresponding questions, the Overall Review Sentiment panel will not appear on the profile.
Review sentiment data is refreshed daily.
Product profiles and product suites
G2 displays average responses to the following review form questions in the Overall Review Sentiment panel for products and product suites.
| Sentiment scale | Review form question | Answer choices |
|---|---|---|
| Time to Implement | How long did it take to go live? | < 1 day, < 1 month, 1-3 months, 3-6 months, 6-12 months, > 12 months, Never |
| Ease of Setup | Ease of Setup | Answer choices range from 1 - 7. |
| Return on Investment | What is your organization's estimated ROI on {reviewed_product} (payback period in months)? | 6 months or less, 7-12 months, 13-24 months, 24-36 months, 37-48 months, 48+ months, Never Got Full Payback |
G2 averages and scales review responses for the corresponding review form questions to generate Overall Review Sentiment charts.
Services
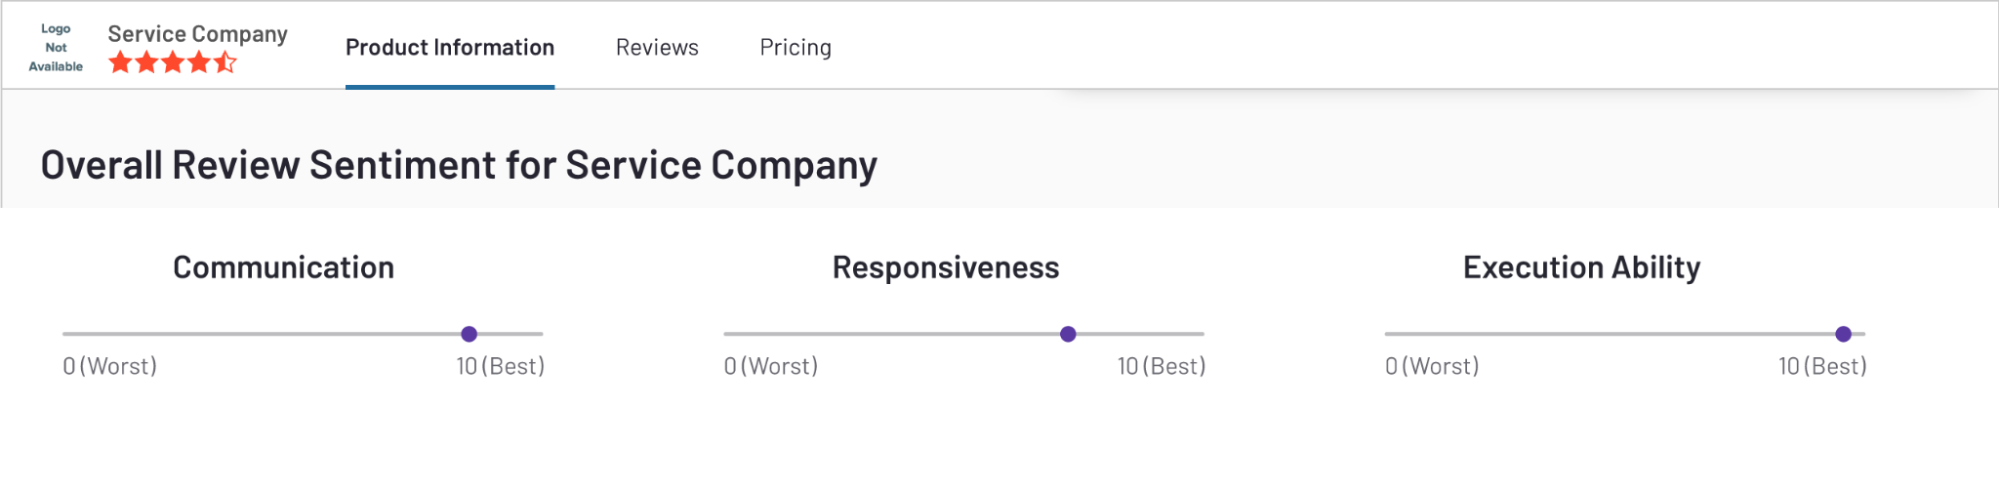
G2 displays average responses to the following review form questions in the Overall Review Sentiment panel for services.
| Sentiment Scale | Review Form Question | Answer Choices |
|---|---|---|
| Communication | Communication Skills | Answer choices range from 1 - 7. |
| Responsiveness | Responsiveness | Answer choices range from 1 - 7. |
| Execution Ability | Execution Ability | Answer choices range from 1 - 7. |
Responses to questions with an answer choice range of 1-7 are converted to a percentage and scaled from 0 to 10.
Category
By default, G2 category pages are sorted by your product or service’s G2 Score. For more information on how G2 Score is calculated, refer to the G2 Score section.

G2 also offers the following category sorting options to buyers:
- Popularity: Sort by the total number of reviews.
- Satisfaction: Sort by Satisfaction score.
To be eligible for G2 Sort, a category must have at least three products with 10+ reviews. Otherwise, products will be sorted by popularity by default.
Alternatives
G2 alternatives pages enable buyers to find solutions most similar in functionality to the featured product or service.
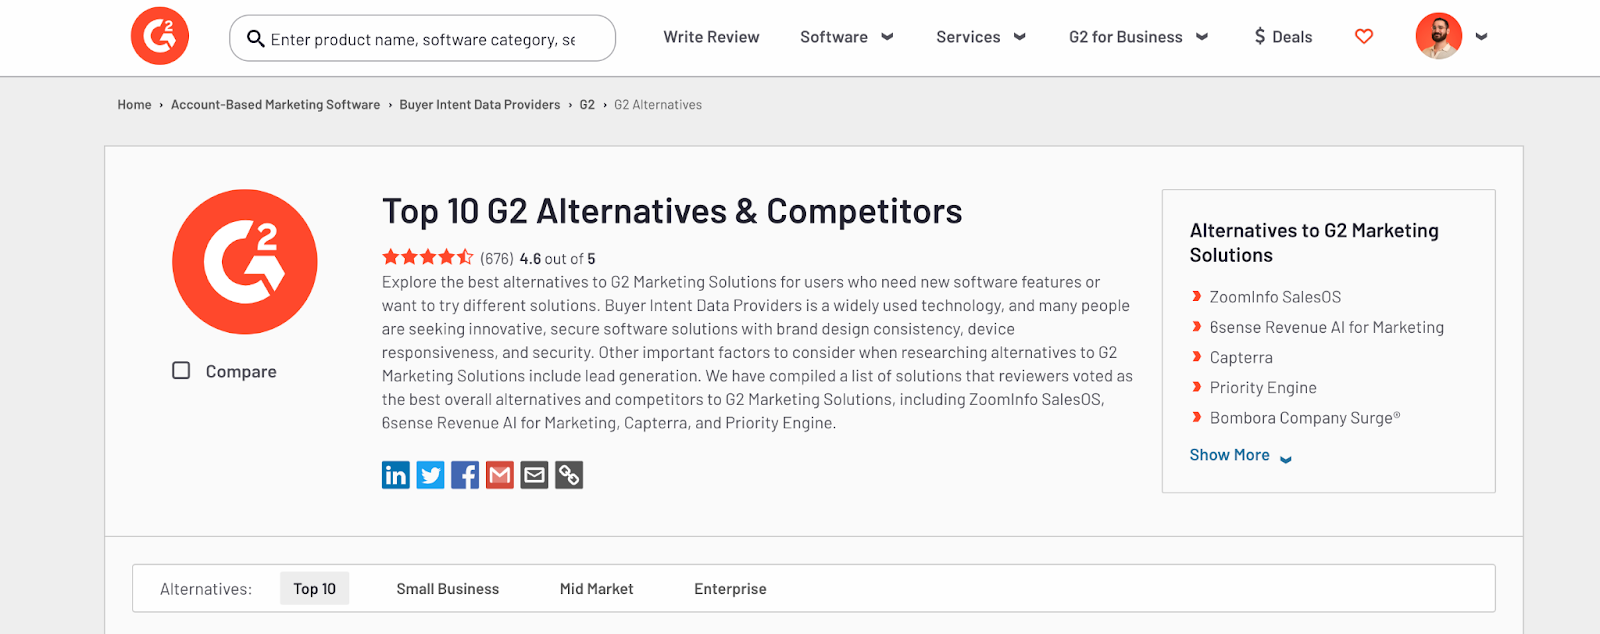
G2 uses the following logic to sort alternatives:
- The number of categories shared between the featured solution and the competitor (breadth of similarity).
- The number of reviews attributed to each category of overlap (depth of similarity).
- The number of comparisons to the competitor made by G2 users (G2 buyer similarity).
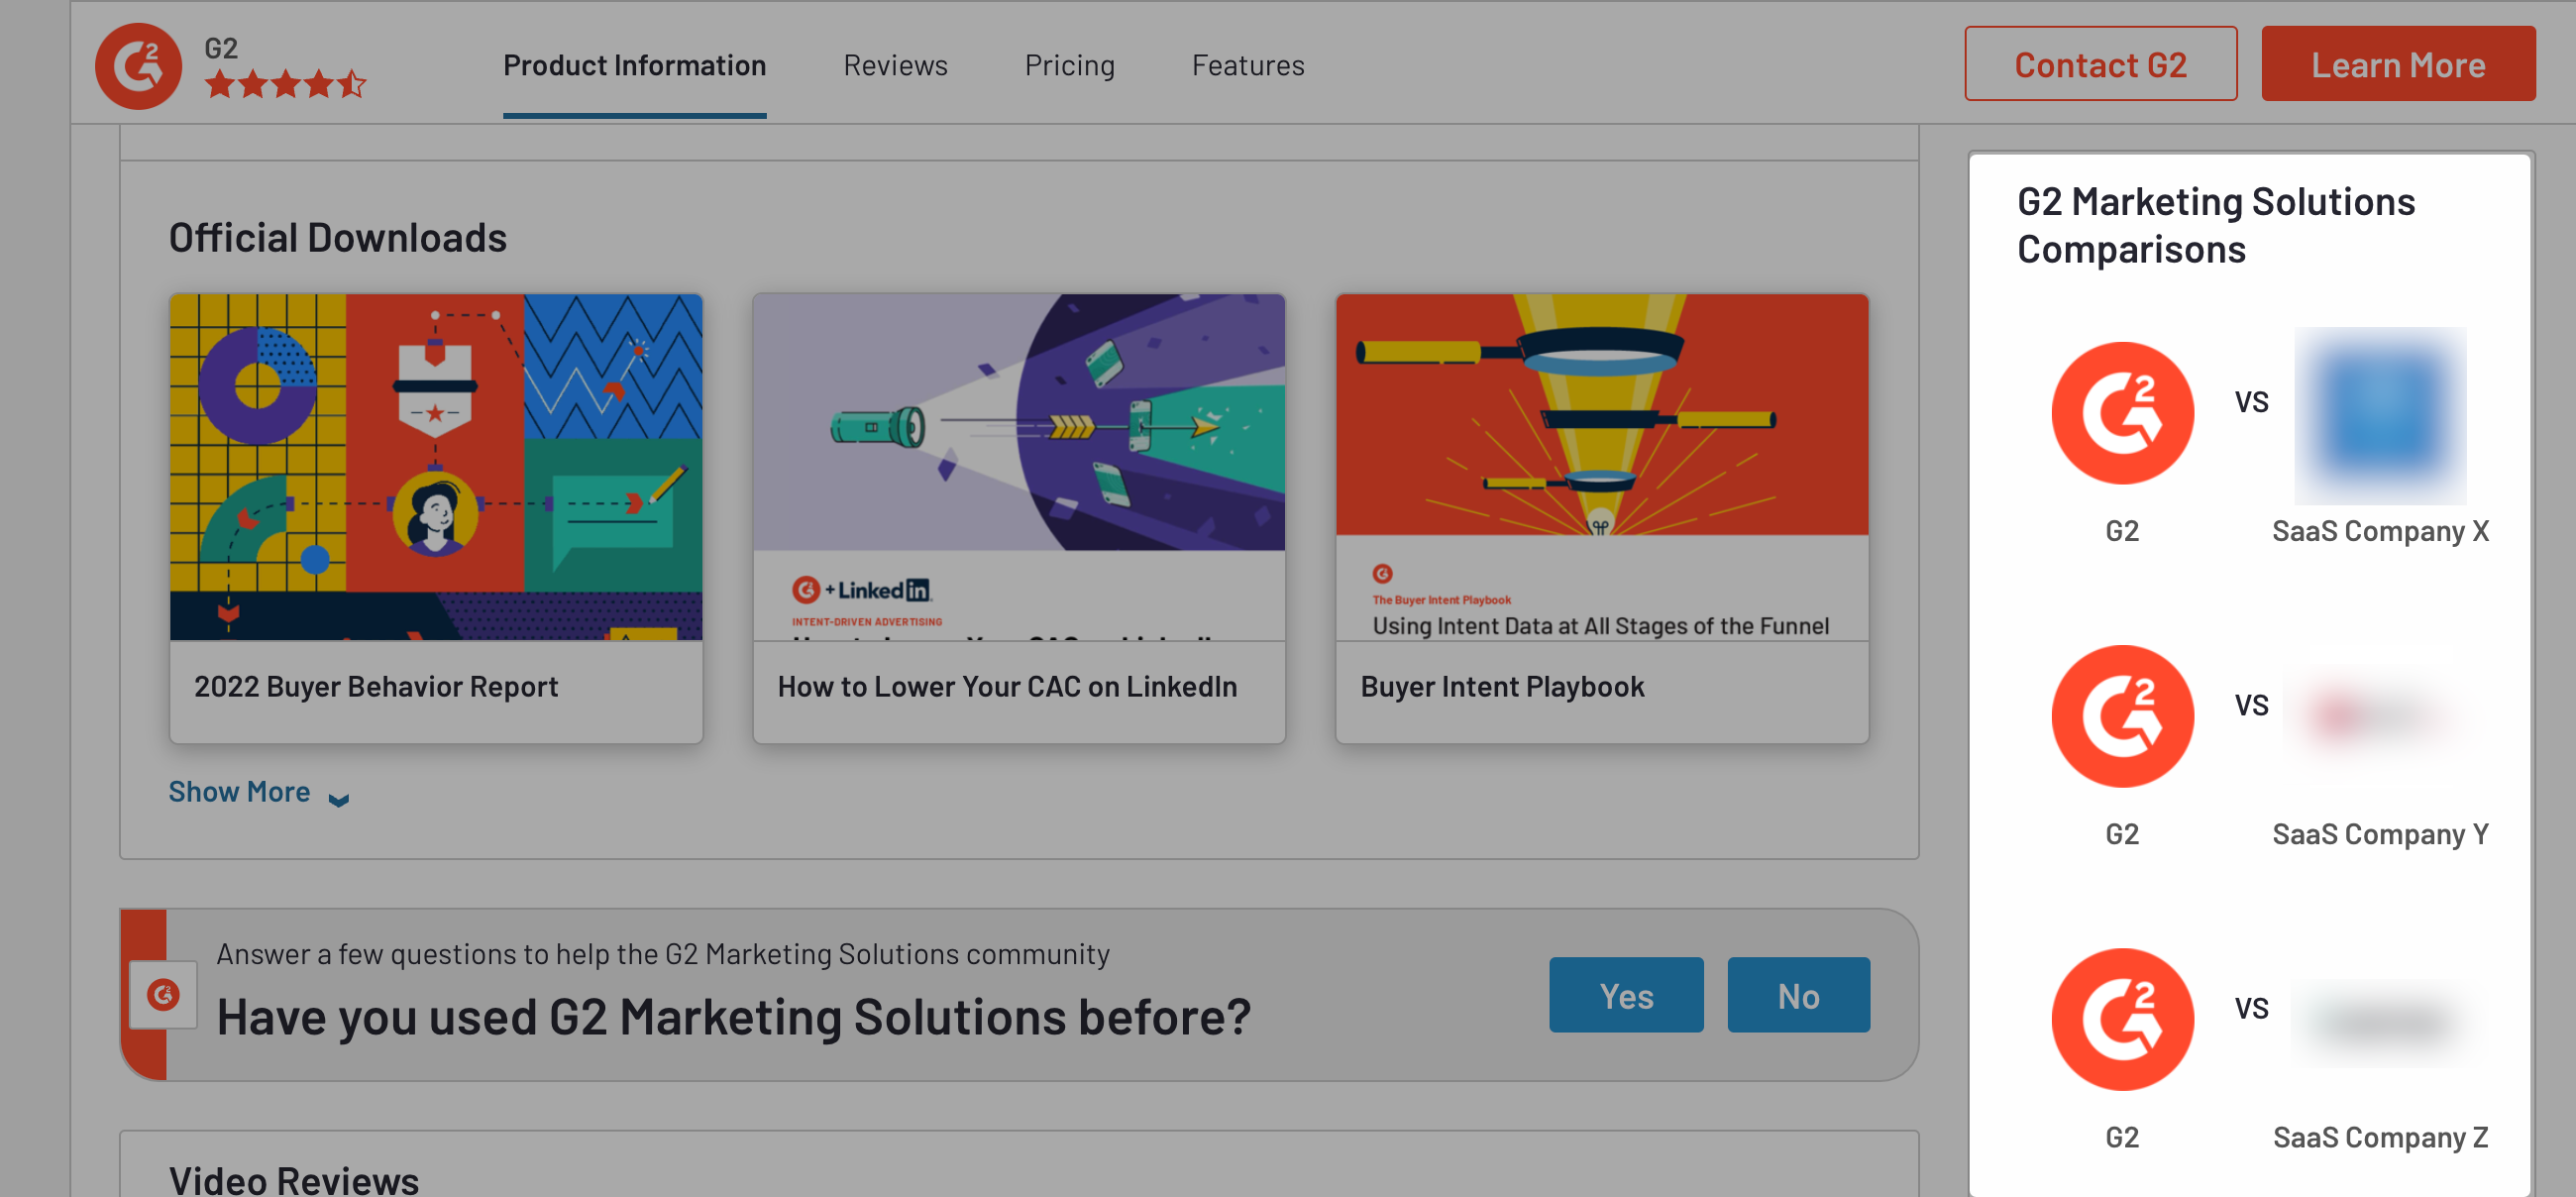
Comparisons
G2 profile pages list the top five comparisons performed by users for each product.
Reporting
G2 releases seasonal market reports to help buyers learn about trends in software and services, compare review ratings, and find the right solution for their needs.
Refer to G2's Research Agenda to access key dates for upcoming G2 reports, including review submission deadlines and report publication dates.
Seasonal market reports are released at the category level. G2 only offers a report when the entire category meets a specific review threshold. For more information on the requirements for a category to be eligible for each report, navigate to the corresponding section of this documentation using the links below.
G2 currently offers seasonal Grid reports per eligible category (including Segment Grids, Regional Grids, and Momentum Grids), as well as a suite of Index reports (including Usability Index, Results Index, Implementation Index, and Relationship Index).
G2 also publishes an annual Best Software report to celebrate superlative software across G2.
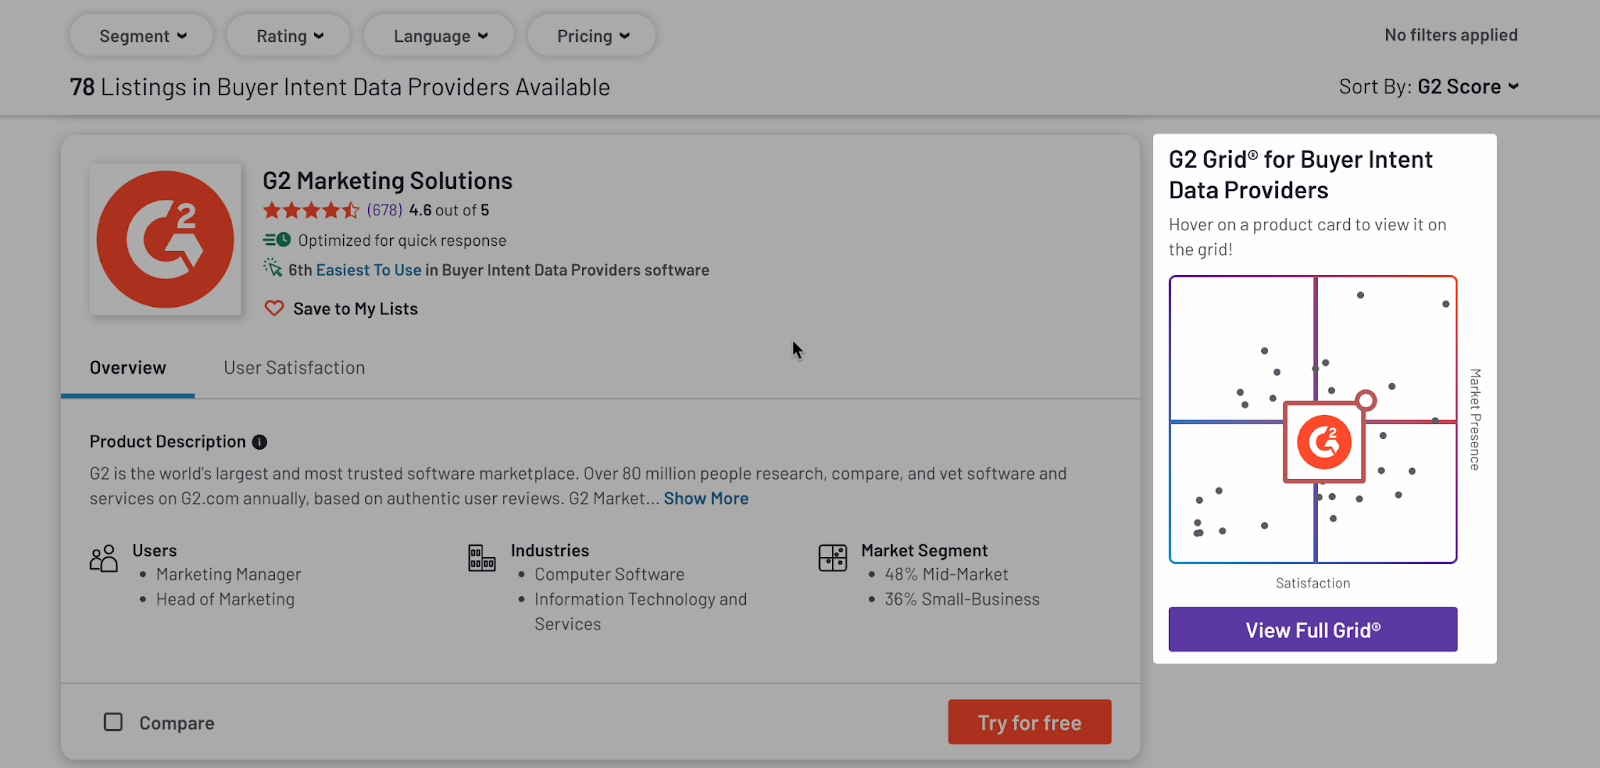
Grid® reports
G2 Grid® helps buyers understand the competitive landscape for a category by plotting each product or service against Satisfaction and Market Presence scores.
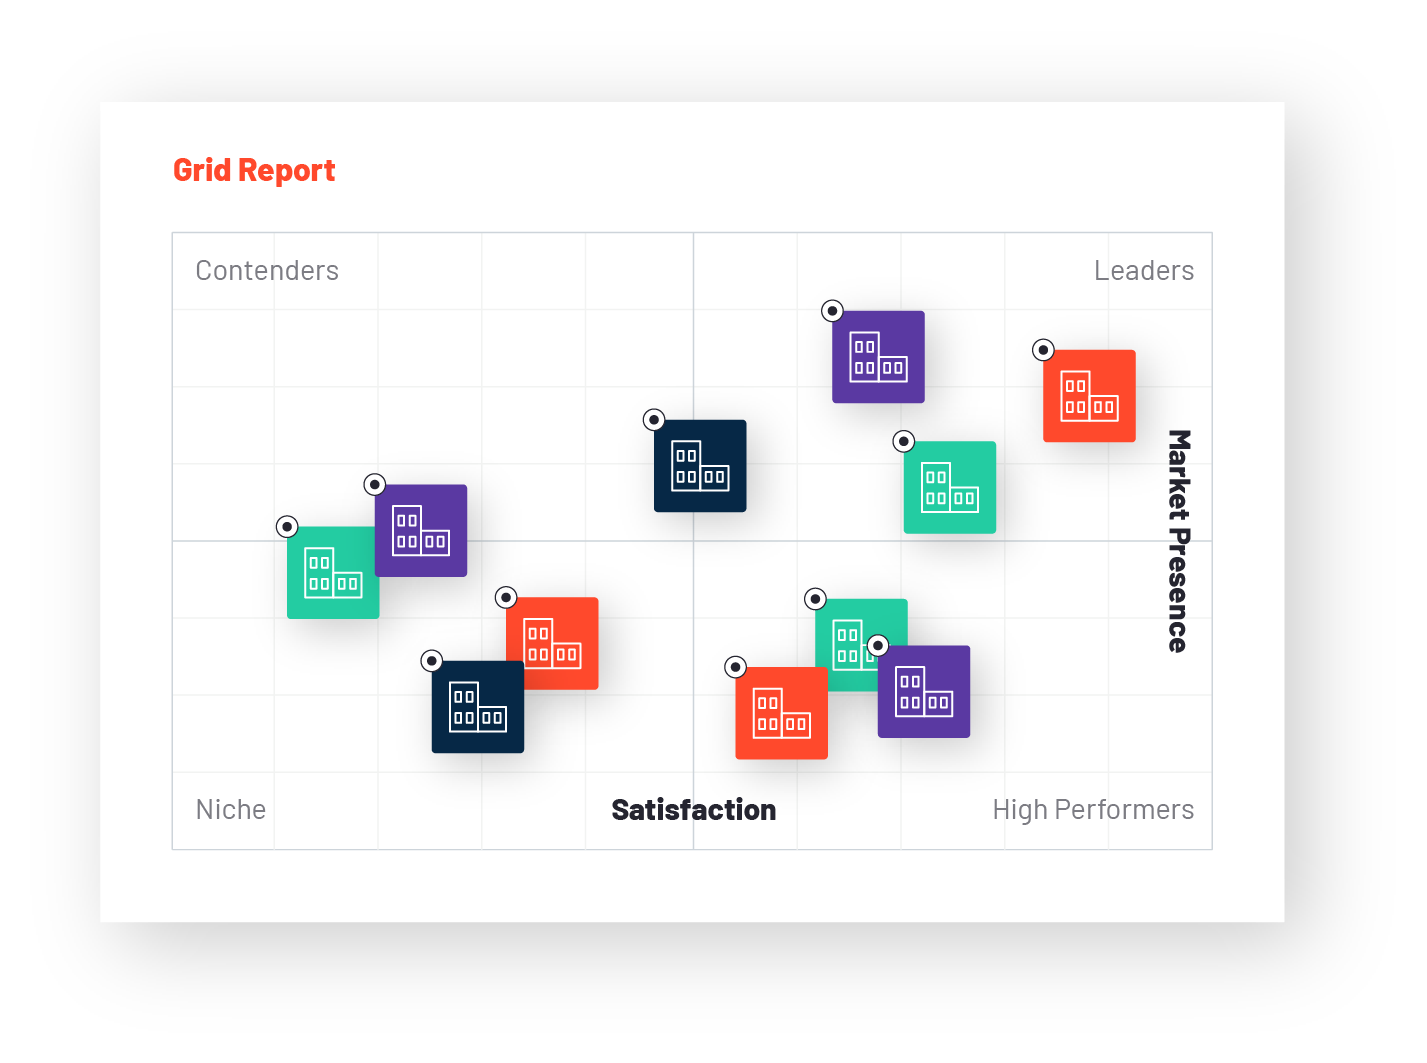
G2 also shows live Grids® on category pages that have at least three products with 10+ reviews. Placement on live Grids® is updated daily.
For a software or service category to be eligible for a Grid® report, it must have at least six products with 10+ reviews, and 150+ reviews overall. To qualify for inclusion, a product or service must have at least 10 reviews in the corresponding category.
To be eligible for a product suite Grid®, a solution must have 10 or more reviews across the defined core categories. An eligible solution’s positioning will be further influenced by supplementary categories with or more reviews. For more information, refer to the Product Suites section.
Segment Grids®
G2 offers Grids® at the market-segment level, which only includes reviews from reviewers who are employed by a company within a particular market segment. G2 uses the following definitions for market segments:
- Small Business: 50 or fewer employees
- Mid-Market: 51–1,000 employees
- Enterprise: 1,001+ employees
Regional Grids®
G2 offers Grids® for each global region, which only includes reviews from reviewers in the corresponding region. G2 uses the following global regions:
- Africa
- ANZ
- Asia
- Asia Pacific
- EMEA
- Europe
- Middle East
- Middle East & Africa
- Southeast Asia
Refer to the Reporting appendix for more information on regional definitions.
Momentum Grid®
G2 offers a Momentum Grid® that highlights products based on growth. The base Market Presence scoring model for this Grid® is adjusted to favor products with large year-over-year changes in employee count, review volume, social following, and web presence.
Both percent (relative) change and total (absolute) change are considered.
Year-over-year changes are tracked from the product’s first appearance on a Grid®, meaning that the earliest a product can appear on Momentum Grid® is one year following its first Grid® report.
Index reports
G2 releases a suite of index reports that highlight the success of a product in a particular area of business. A unique, patent-pending algorithm is used to rank products based on responses to specific groups of questions on the G2 review form. To be eligible for an index report, a category must have:
- 150+ reviews across all products in the category.
- At least six products with 10+ reviews and at least five responses to the report-specific questions described in the following table.
| Index report | Review form questions (listed in order of importance) |
|---|---|
| Usability |
|
| Results |
|
| Implementation |
|
| Relationship |
|
To qualify for inclusion, a product or service must have at least 10 reviews.
G2 also offers each index report per market segment, which only includes reviews from reviewers employed by a company within a particular market segment. G2 uses the following definitions for market segments:
- Small Business: 50 or fewer employees
- Mid-Market: 51–1,000 employees
- Enterprise: 1,001+ employees
Best Software
Each year, G2 publishes Best Software reports to celebrate top-performing products and vendors across G2.
To be eligible for Best Software Products and Best Software Companies lists, a vendor must have at least 50 published reviews (in aggregate across all of their G2-listed products) in the preceding calendar year.
Only reviews submitted between January 1st and December 31st of the preceding calendar year are considered for eligibility and ranking. Once a vendor has 50 reviews in the preceding year, all of their G2-listed products are eligible for inclusion in a Best Software Products list.
Business partner reviews count toward the eligibility requirements for Best Software lists, but they are not included in ranking calculations.
To compare products and vendors across different categories, G2 uses normalized Satisfaction and Market Presence scores. For more information, refer to the G2 Score and Normalization sections.
Best Software Companies
The top 100 software companies are ranked based on weighted Satisfaction and Market Presence scores. Specifically, G2 aggregates Satisfaction scores across all of a vendor’s products with 5+ reviews in the evaluation period and 10+ reviews overall. Market Presence is aggregated and scored relative to all companies with 10+ reviews.
G2 also releases regional Best Software Companies reports, which highlight the top 50 companies from the corresponding global region. Several factors are used to determine a software company’s region, including where the company was founded, where its executive team resides, and where the majority of its workforce is located.
The ANZ, France, and Germany regional Best Software Companies lists only require 25 reviews in the preceding calendar year to be eligible.
Best Software Products
The top 100 products are ranked based on weighted Satisfaction and Market Presence scores. Specifically, the score for a product is first calculated for each category, and then those category scores are combined to create an overall score for the product. The overall score is then weighted based on the competitiveness of each category.
Competitiveness is determined by how many products are competing in each category and how many reviews those products receive.
G2 also releases the following supplemental Best Software Products reports:
- Highest Satisfaction: Ranking is based solely on Satisfaction scores.
- Fastest Growing Products: Ranking is based on Momentum scores.
- Segment: Rankings are based on reviews submitted by reviewers from the corresponding market segment.
- Best Software by Function: Rankings are based on reviews from the corresponding top-level G2 categories. Products must have a minimum of 10 reviews within the corresponding category to be eligible.
- Rookies of the Year: This report includes the top 25 products that were listed on G2 and received their first review during the previous calendar year. To qualify for inclusion, both the product and its corresponding vendor must be newly-listed.
Vendors must still meet the Best Software review threshold for their products to be included in a supplemental report. Scores are weighted and normalized similarly to the main Best Software Products report.
All supplemental Best Software Products reports, with the exception of the Rookies of the Year report, list the top 50 products.
Accessing your reports and awards
You can access your reports and report-based awards from the Report Library tab in my.G2,
G2 displays draft reports in this tab approximately two weeks prior to each report release.
Reporting appendix
Report schedule
Refer to G2's Research Agenda to access key dates for upcoming G2 reports, including review submission deadlines and report publication dates.
Regional definitions
The following table lists the countries included in each of G2’s regional reports.
| Region | Countries |
|---|---|
| Africa | Algeria; Angola; Benin; Botswana; Burkina Faso; Burundi; Cameroon; Cape Verde; Central African Republic; Chad; Comoros; Congo; Congo, the Democratic Republic of the; Côte d'Ivoire; Djibouti; Equatorial Guinea; Eritrea; Ethiopia; Gabon; Gambia; Ghana; Guinea; Guinea-Bissau; Kenya; Lesotho; Liberia; Libya; Madagascar; Malawi; Mali; Mauritania; Mauritius; Mayotte; Morocco; Mozambique; Namibia; Niger; Nigeria; Rwanda; Réunion; Saint Helena, Ascension and Tristan da Cunha; Sao Tome and Principe; Senegal; Seychelles; Sierra Leone; Somalia; South Africa; South Sudan; Sudan; Swaziland; Tanzania, United Republic of; Togo; Tunisia; Uganda; Western Sahara; Zambia; Zimbabwe |
| ANZ | American Samoa; Australia; Cook Islands; Fiji; French Polynesia; Guam; Kiribati; Marshall Islands; Micronesia, Federated States of; Nauru; New Caledonia; New Zealand; Niue; Norfolk Island; Northern Mariana Islands; Palau; Papua New Guinea; Pitcairn; Samoa; Solomon Islands; Tokelau; Tonga; United States Minor Outlying Islands; Vanuatu; Wallis and Futuna |
| Asia | Afghanistan; Bangladesh; Bhutan; British Indian Ocean Territory; Brunei Darussalam; Cambodia; China; Christmas Island; Cocos (Keeling) Islands; Hong Kong; India; Indonesia; Japan; Kyrgyzstan; Laos; Macao; Malaysia; Maldives; Mongolia; Myanmar; Nepal; North Korea; Pakistan; Philippines; Singapore; South Korea; Sri Lanka; Taiwan, Province of China; Tajikistan; Thailand; Timor-Leste; Turkmenistan; Uzbekistan; Viet Nam |
| Asia Pacific | Afghanistan; American Samoa; Australia; Azerbaijan; Bangladesh; Bhutan; British Indian Ocean Territory; Cambodia; China; Christmas Island; Cocos (Keeling) Islands; Cook Islands; Fiji; French Polynesia; Guam; Hong Kong; India; Indonesia; Japan; Kazakhstan; Kiribati; Kyrgyzstan; Laos; Macao; Malaysia; Maldives; Marshall Islands; Mauritania; Micronesia, Federated States of; Mongolia; Myanmar; Nauru; Nepal; New Caledonia; New Zealand; Niue; Norfolk Island; North Korea; Northern Mariana Islands; Pakistan; Palau; Papua New Guinea; Philippines; Pitcairn; Samoa; Singapore; Solomon Islands; South Korea; Sri Lanka; Taiwan, Province of China; Tajikistan; Thailand; Timor-Leste; Tokelau; Tonga; Turkmenistan; Tuvalu; United States Minor Outlying Islands; Uzbekistan; Vanuatu; Viet Nam; Wallis and Futuna |
| EMEA | Albania; Algeria; Andorra; Angola; Armenia; Austria; Bahrain; Belarus; Belgium; Benin; Bosnia and Herzegovina; Botswana; Brunei Darussalam; Bulgaria; Burkina Faso; Burundi; Cameroon; Cape Verde; Central African Republic; Chad; Comoros; Congo; Congo, the Democratic Republic of the; Croatia; Cyprus; Czech Republic; Côte d'Ivoire; Denmark; Djibouti; Egypt; Equatorial Guinea; Eritrea; Estonia; Ethiopia; Faroe Islands; Finland; France; Gabon; Gambia; Georgia; Germany; Ghana; Gibraltar; Greece; Greenland; Guernsey; Guinea; Guinea-Bissau; Hungary; Iceland; Iran; Iraq; Ireland; Isle of Man; Israel; Italy; Jersey; Jordan; Kenya; Kuwait; Latvia; Lebanon; Lesotho; Liberia; Libya; Liechtenstein; Lithuania; Luxembourg; Macedonia; Madagascar; Malawi; Mali; Malta; Mauritius; Mayotte; Moldova; Monaco; Montenegro; Morocco; Mozambique; Namibia; Netherlands; Niger; Nigeria; Norway; Oman; Palestine; Poland; Portugal; Qatar; Romania; Russia; Rwanda; Réunion; Saint Helena, Ascension and Tristan da Cunha; San Marino; Sao Tome and Principe; Saudi Arabia; Senegal; Serbia; Seychelles; Sierra Leone; Slovakia; Slovenia; Somalia; South Africa; South Sudan; Spain; Sudan; Svalbard and Jan Mayen; Swaziland; Sweden; Switzerland; Syria; Tanzania, United Republic of; Togo; Tunisia; Turkey; Uganda; Ukraine; United Arab Emirates; United Kingdom; Western Sahara; Yemen; Zambia; Zimbabwe |
| Europe | Albania; Andorra; Austria; Belarus; Belgium; Bosnia and Herzegovina; Bulgaria; Croatia; Cyprus; Czech Republic; Denmark; Estonia; Finland; France; Germany; Greece; Greenland; Hungary; Iceland; Ireland; Italy; Latvia; Liechtenstein; Lithuania; Luxembourg; Malta; Moldova; Monaco; Montenegro; Netherlands; Norway; Poland; Portugal; Romania; Russia; San Marino; Serbia; Slovakia; Slovenia; Spain; Sweden; Switzerland; Ukraine; United Kingdom |
| Middle East | Armenia; Azerbaijan; Bahrain; Egypt; Georgia; Iran; Iraq; Israel; Jordan; Kazakhstan; Kuwait; Lebanon; Oman; Palestine; Qatar; Saudi Arabia; Syria; Turkey; United Arab Emirates; Yemen |
| Middle East & Africa | Algeria; Angola; Bahrain; Benin; Botswana; Burkina Faso; Burundi; Cameroon; Cape Verde; Central African Republic; Chad; Comoros; Congo, the Democratic Republic of the; Cyprus; Djibouti; Egypt; Equatorial Guinea; Eritrea; Ethiopia; Gabon; Gambia; Ghana; Guinea; Guinea-Bissau; Iran; Iraq; Israel; Jordan; Kenya; Kuwait; Lebanon; Lesotho; Liberia; Libya; Madagascar; Malawi; Mali; Mauritania; Mauritius; Mayotte; Morocco; Mozambique; Namibia; Niger; Nigeria; Oman; Palestine; Qatar; Rwanda; Réunion; Saint Helena, Ascension and Tristan da Cunha; Sao Tome and Principe; Saudi Arabia; Senegal; Seychelles; Sierra Leone; Somalia; South Africa; South Sudan; Sudan; Syria; Tanzania, United Republic of; Togo; Tunisia; Turkey; Uganda; United Arab Emirates; Western Sahara; Yemen; Zambia; Zimbabwe |
| Southeast Asia | Brunei Darussalam; Cambodia; Indonesia; Laos; Malaysia; Myanmar; Philippines; Singapore; Thailand; Timor-Leste; Viet Nam |